General trace information
This page contains generic and detailed information about the askalon-new_ee38 trace. High-level (generic) information is provided first followed by more in-depth characterizations.
Trace description
Wien2k uses a full-potential Linearized Augmented Plane Wave (LAPW) approach for the computation of crystalline solids.
Author(s) of this trace:
Download & citing this trace
The trace can be downloaded and cited through Zenodo in the following format(s):
Generic workload information
| Trace id | Workflows | Tasks | Sites | Users | Resource Seconds |
|---|---|---|---|---|---|
| askalon-new_ee38 | 50 | 1,450 | 50 | 1 | 8,155.636 |
Resource Task Statistics
| Min | 25th percentile | Mean | Median | 75th percentile | Max | Standard deviation | Coefficient of variation |
|---|---|---|---|---|---|---|---|
| 1.00 | 1.00 | 1.00 | 1.00 | 1.00 | 1.00 | 0.00 | 0.00 |
Task Memory Usage
This trace does not contain task memory information.
Task Disk Usage
This trace does not contain disk usage information.
Task Network Usage
This trace does not contain network usage information.
Task Energy Usage
This trace does not contain energy information.
Detailed job (workflow) statistics
This section contains information regarding job-level (workflow) statistics. This granularity allows for practitioners to estimate the load of the workload on the system, investigate the characteristics of the workflows, and related metrics.
Job Arrival Graph
The Job arrival graph depicts how many jobs (workflows) arrive over time. The figure below consists of four sub-plots, depicting four different granularities for the horizontal axis: seconds, minutes, hours, and days. The vertical axis depicts the amount of jobs arriving.
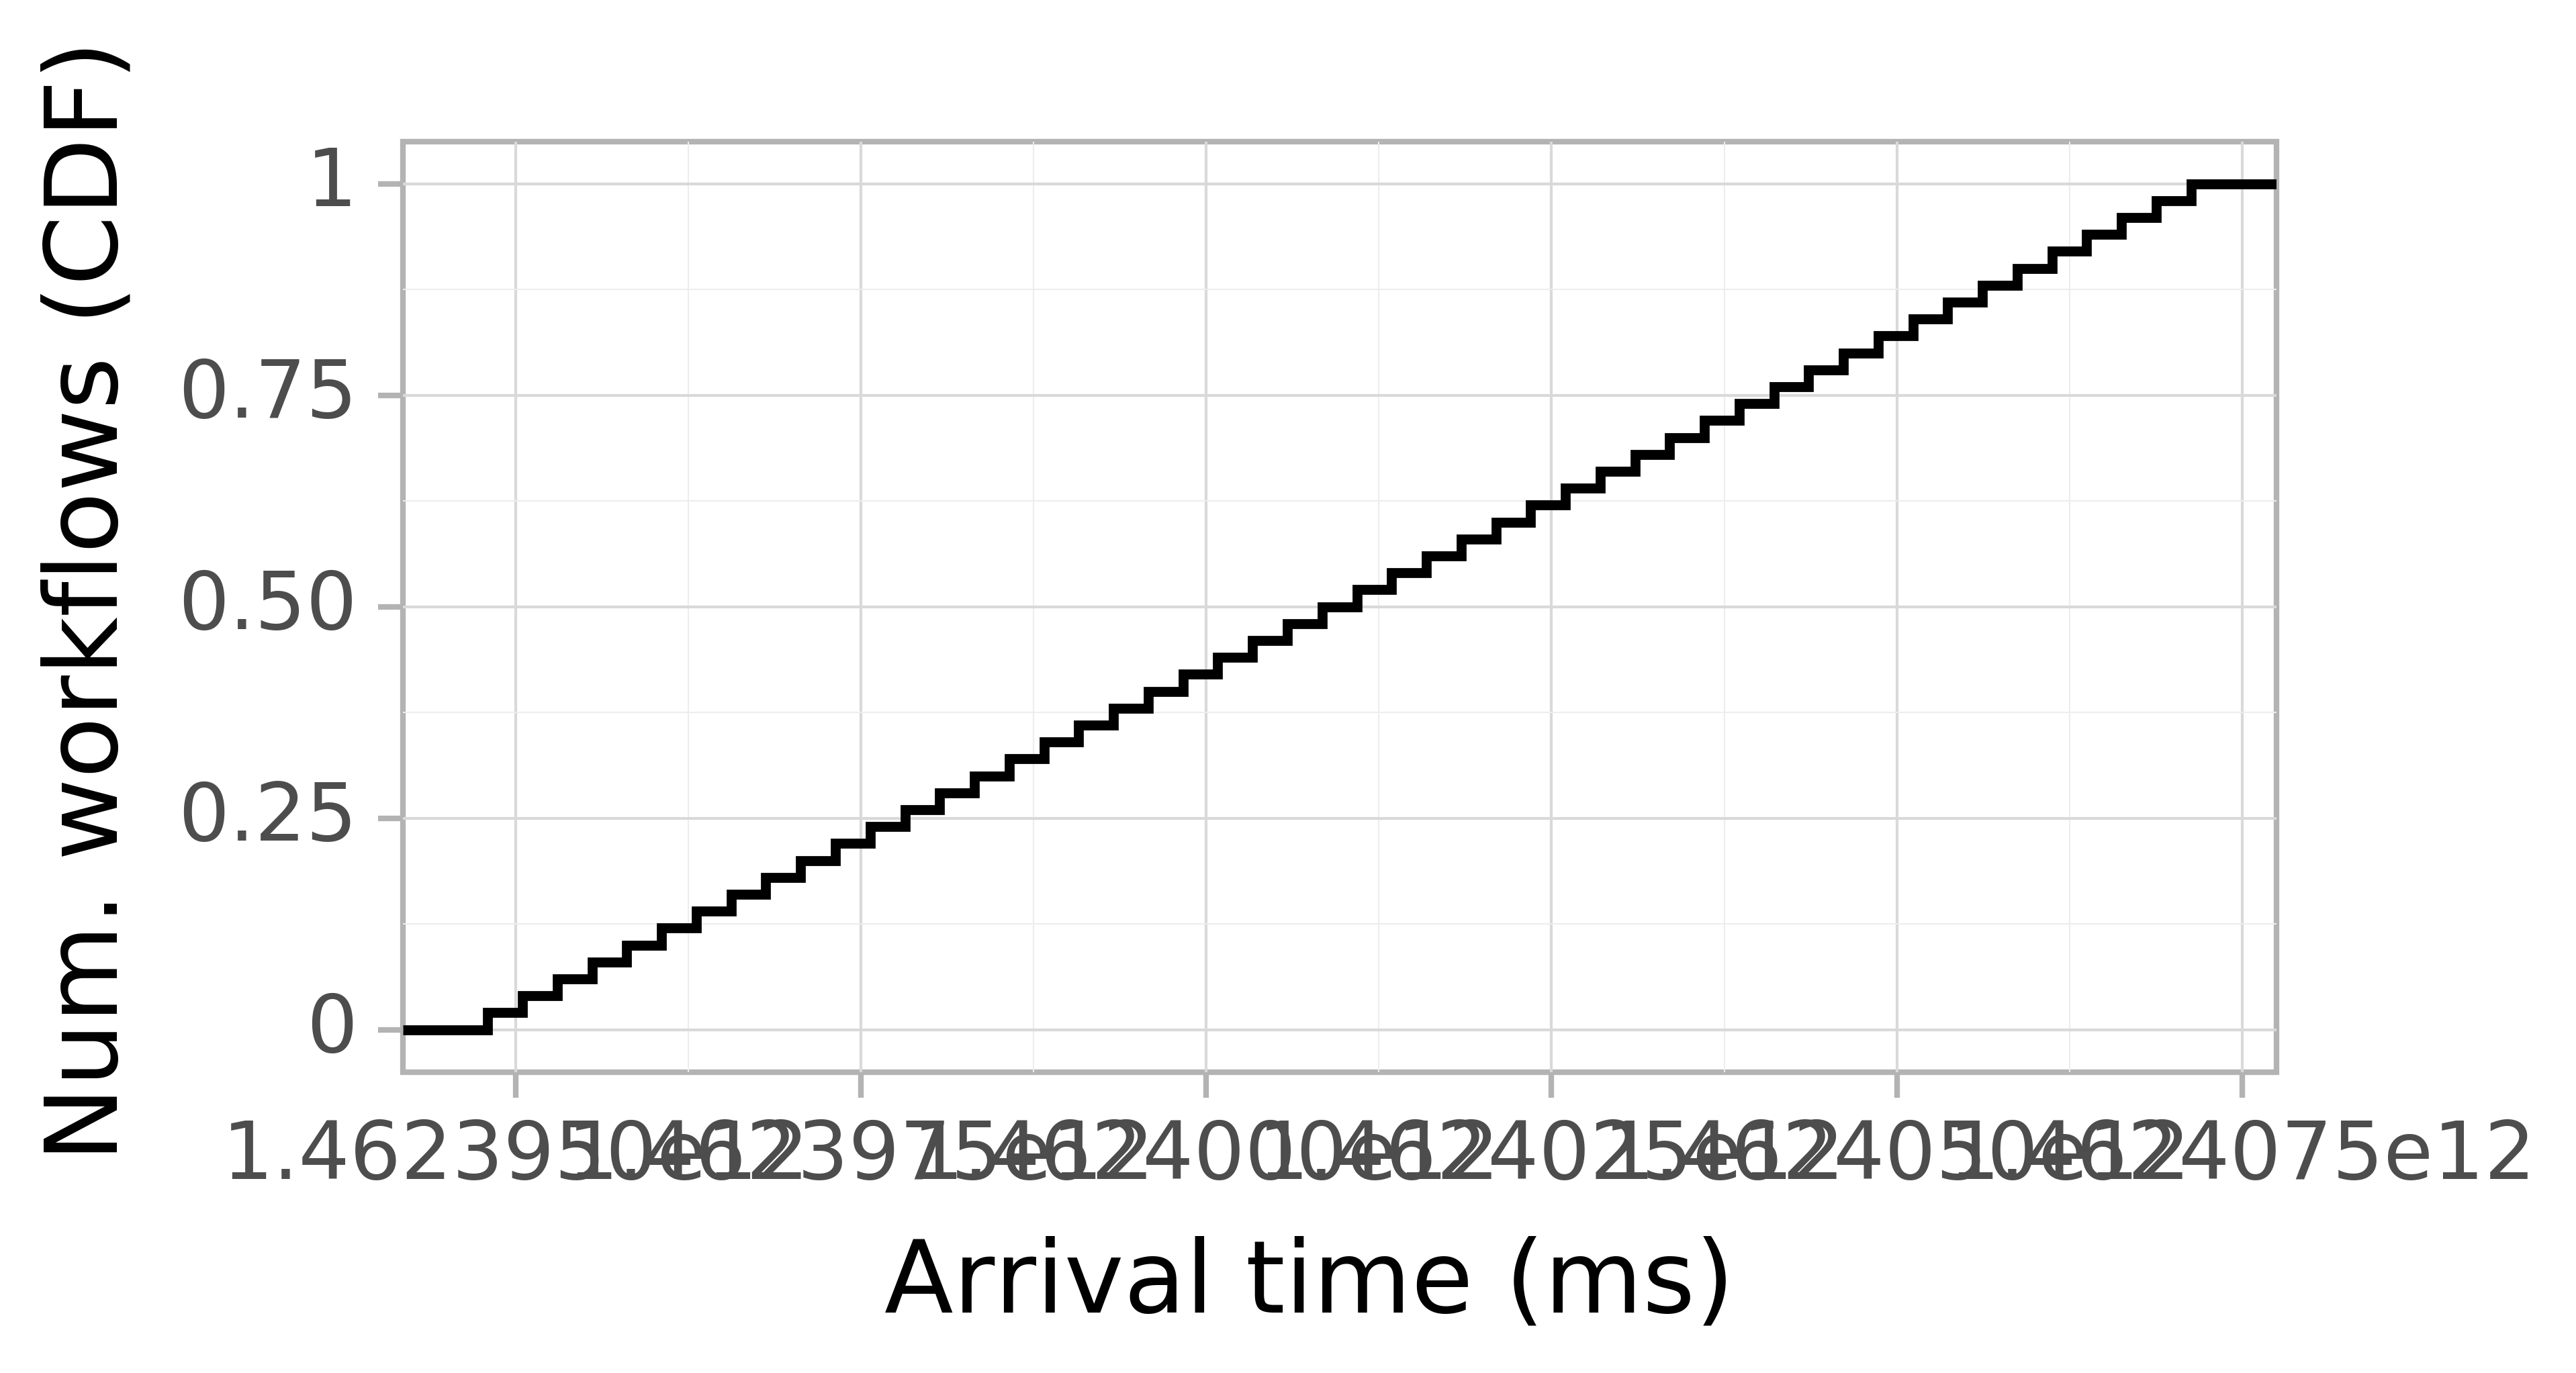
Job Arrival CDF
The Job arrival CDF depicts how many jobs (workflows) arrive at a certain moment. We use the arrival time of the first task of a workflow as the arrival of the workflow itself. The figure below depicts the CDF. The horizontal axis depicts the arrival time in seconds based on the arrival times in the trace. The vertical axis depicts the probability.
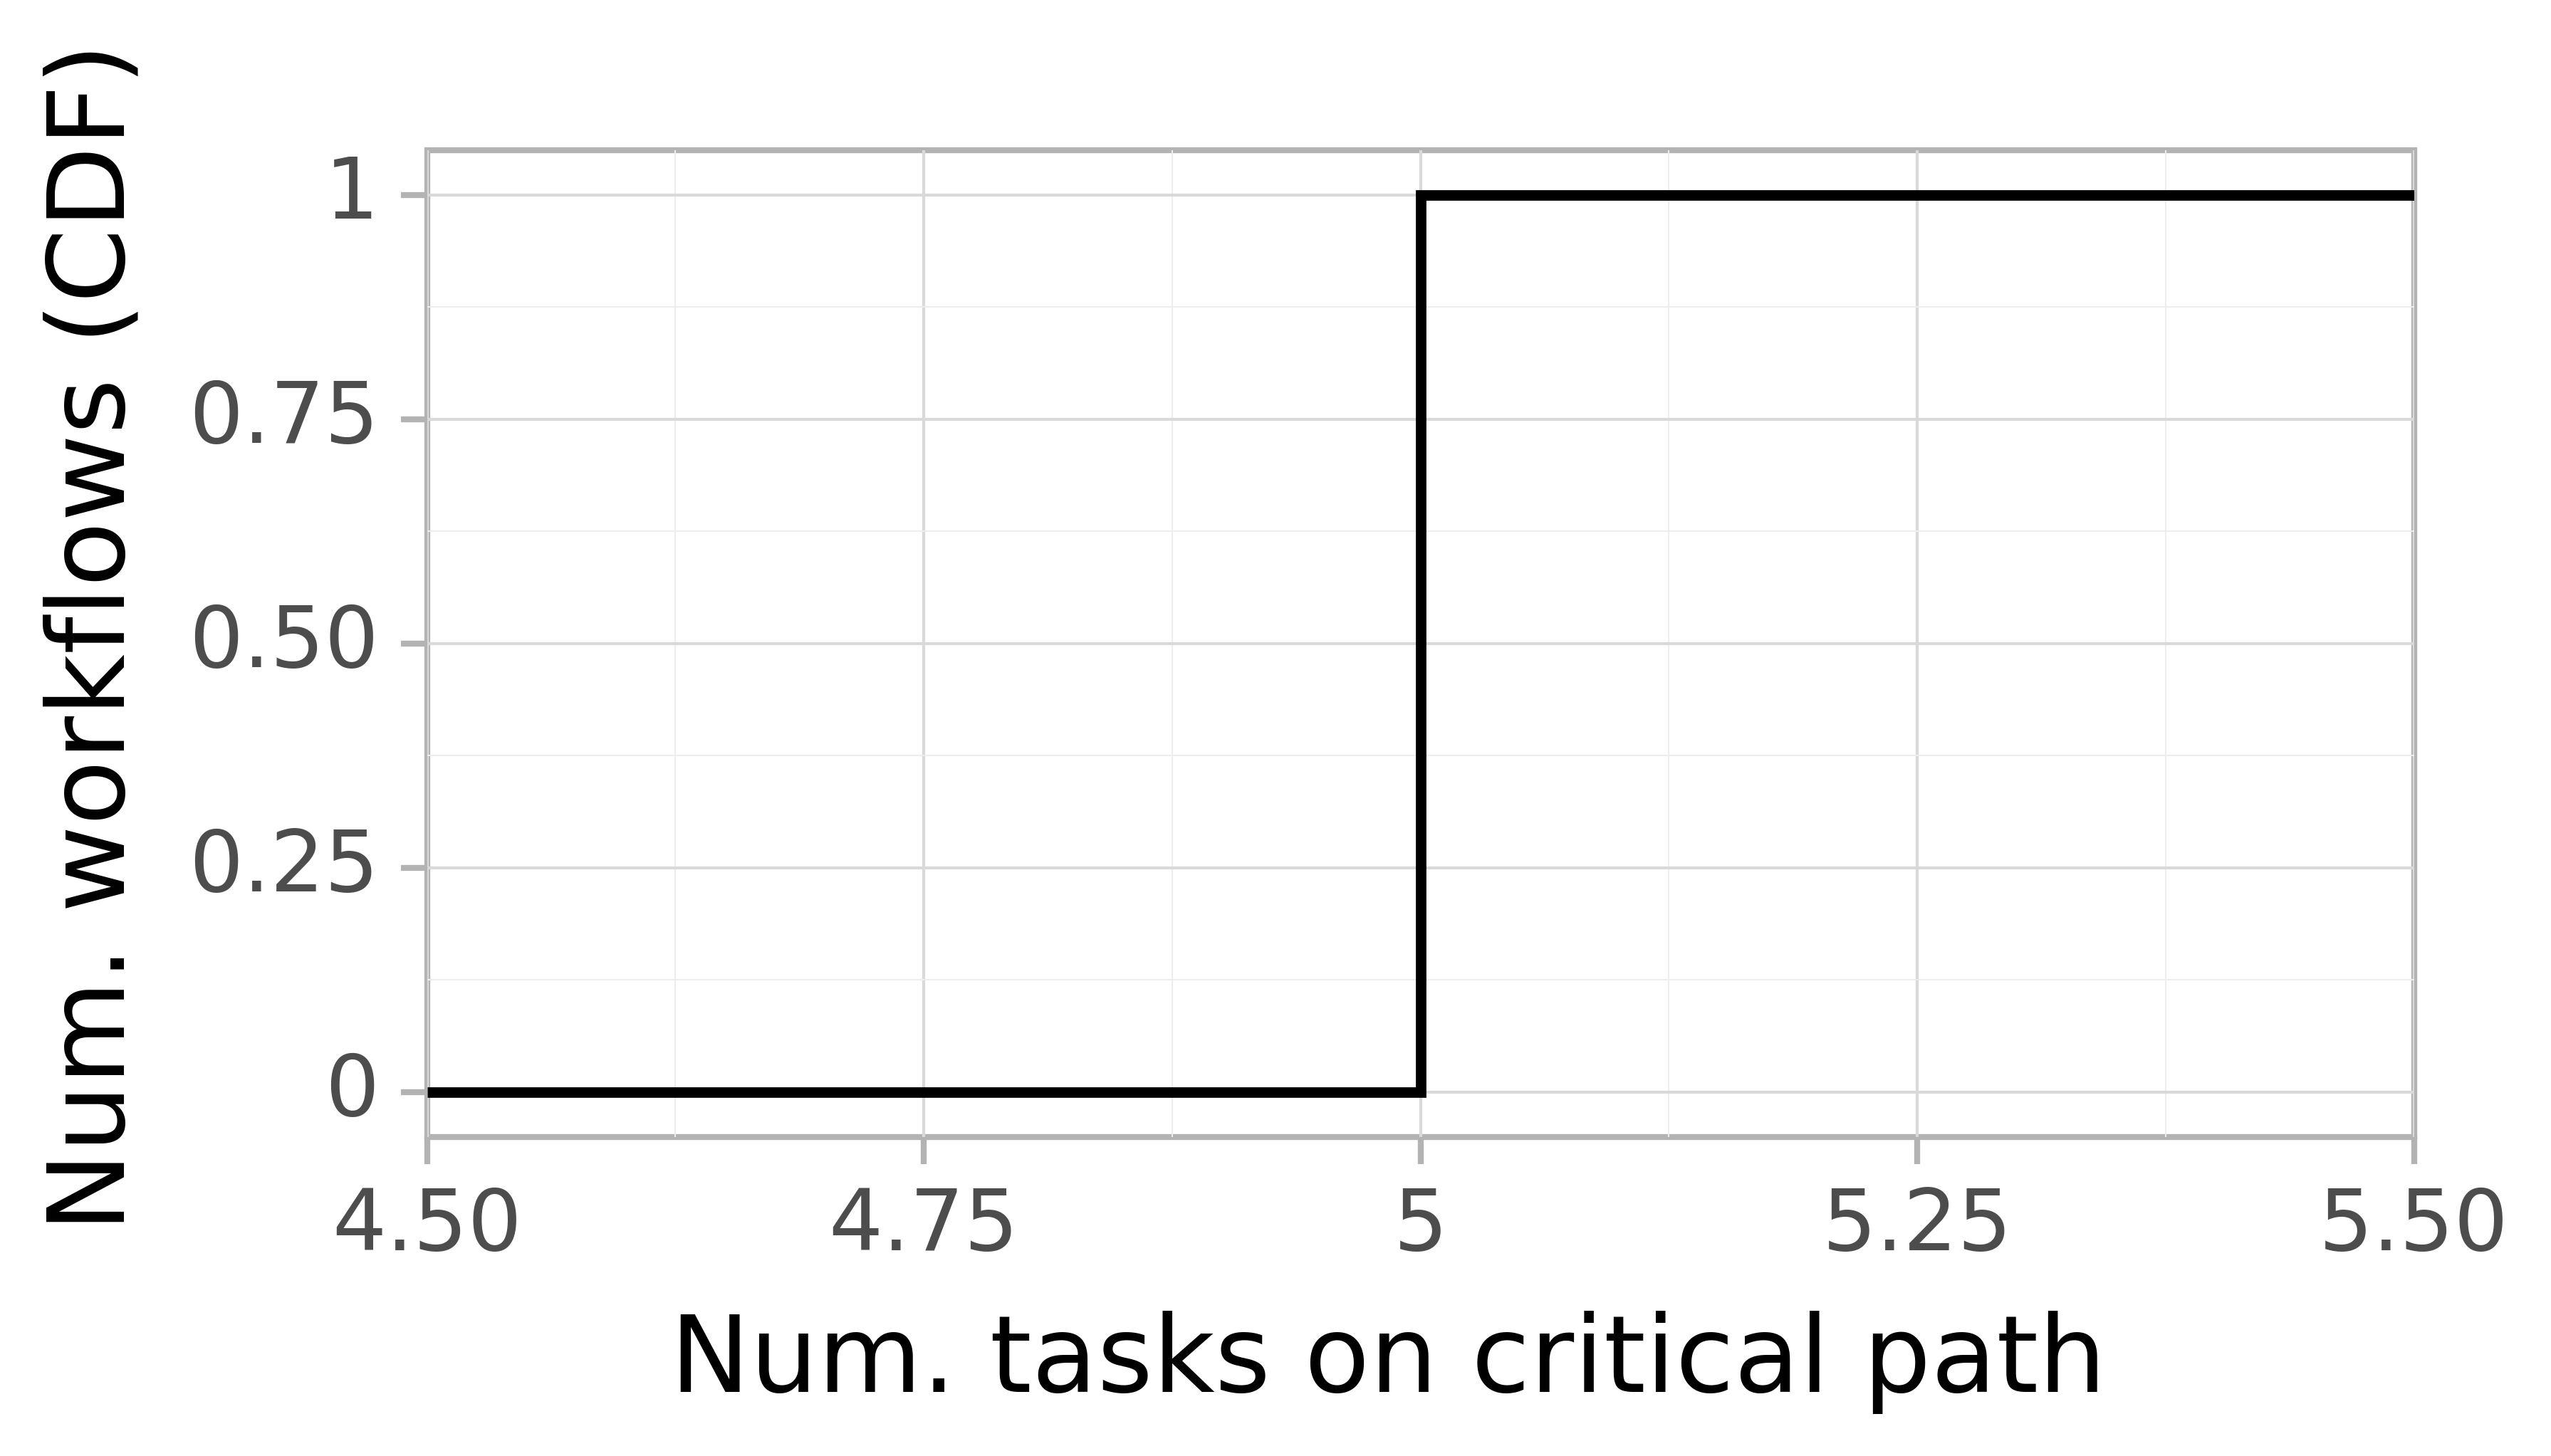
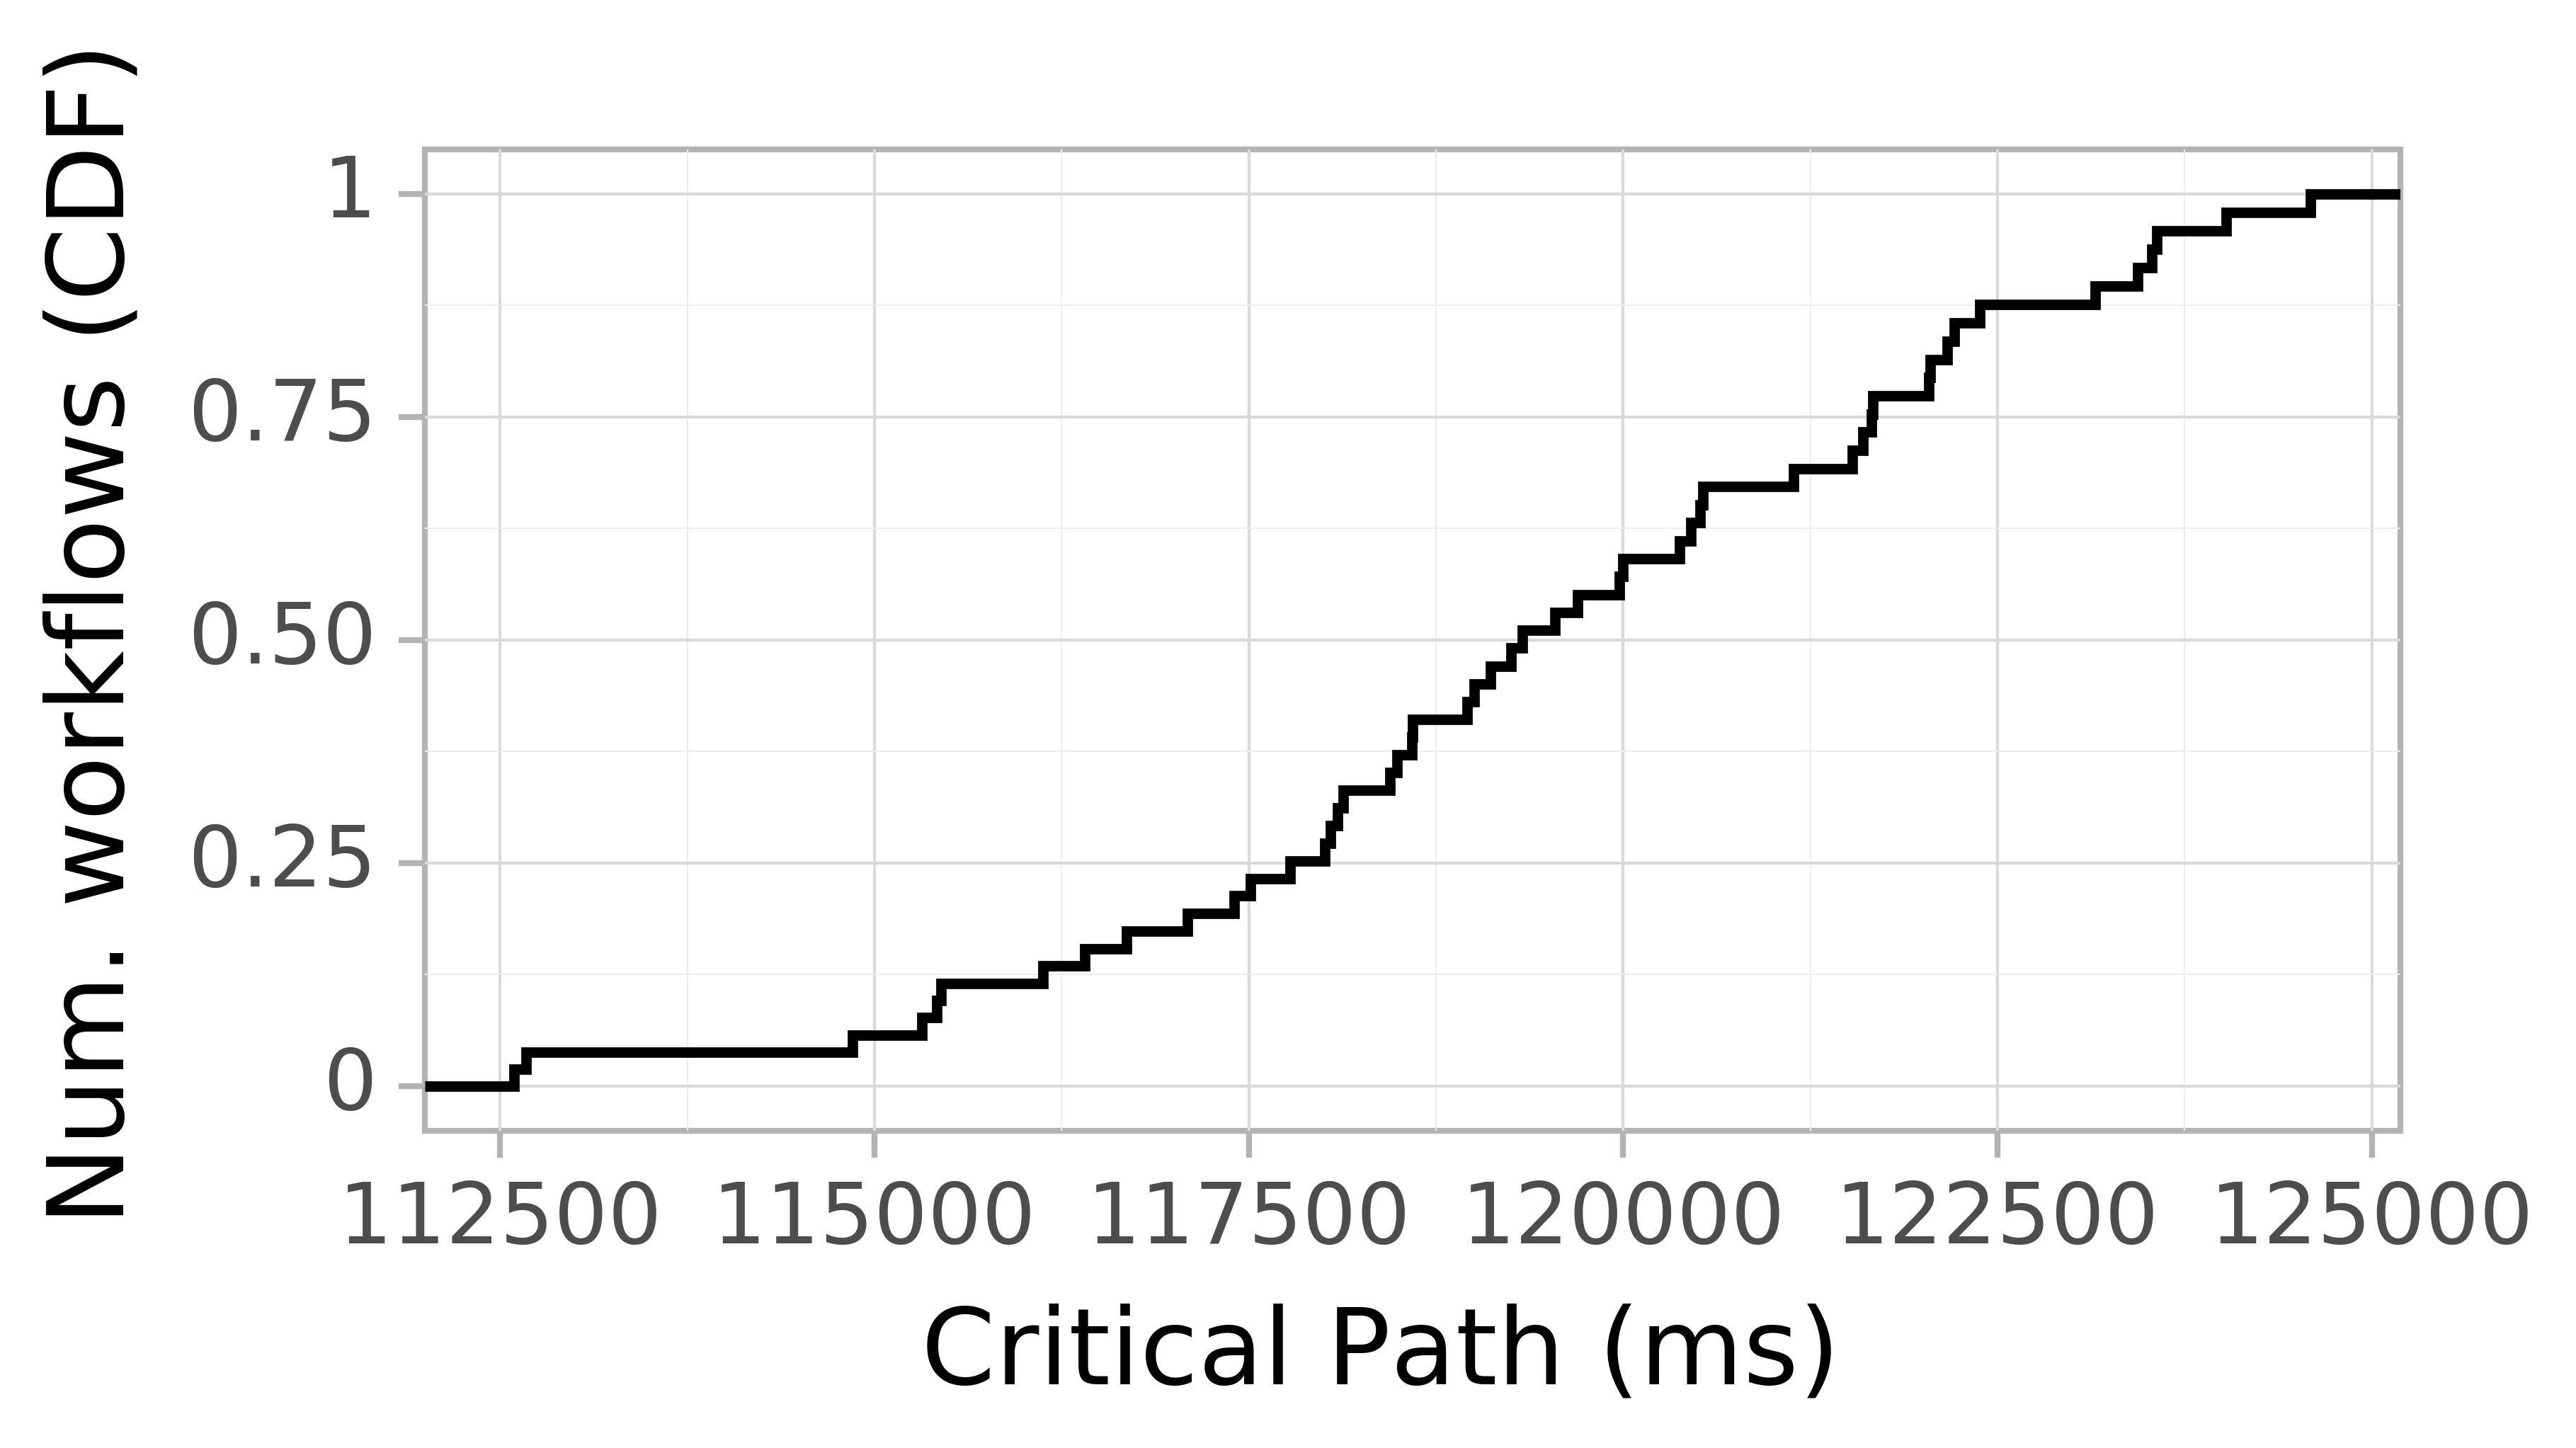
Job Critical Path Task Count CDF
The critical path of a workflow is the longest path from any start node to any end node, defining the minimum time required to execute the workflow. The figure below depicts the CDF of the task count of the critical path per workflow on the horizontal axis. The vertical axis depicts the probability.
Job Runtime CDF
The job runtime runtime depicts the job's actual execution time in the system. Since shortage of resources may prevent tasks from running, the execution time could be (significantly) higher than the critical path. The figure below depicts on the horizontal axis the job runtime in seconds. The vertical axis depicts the occurrences.
Detailed task information
This section contains information related to the tasks in the workload. This granularity of information allows practitioners to gain intrinsic metrics related to the workflows in the workload, task properties (i.e., resource consumption), and the workload overall.
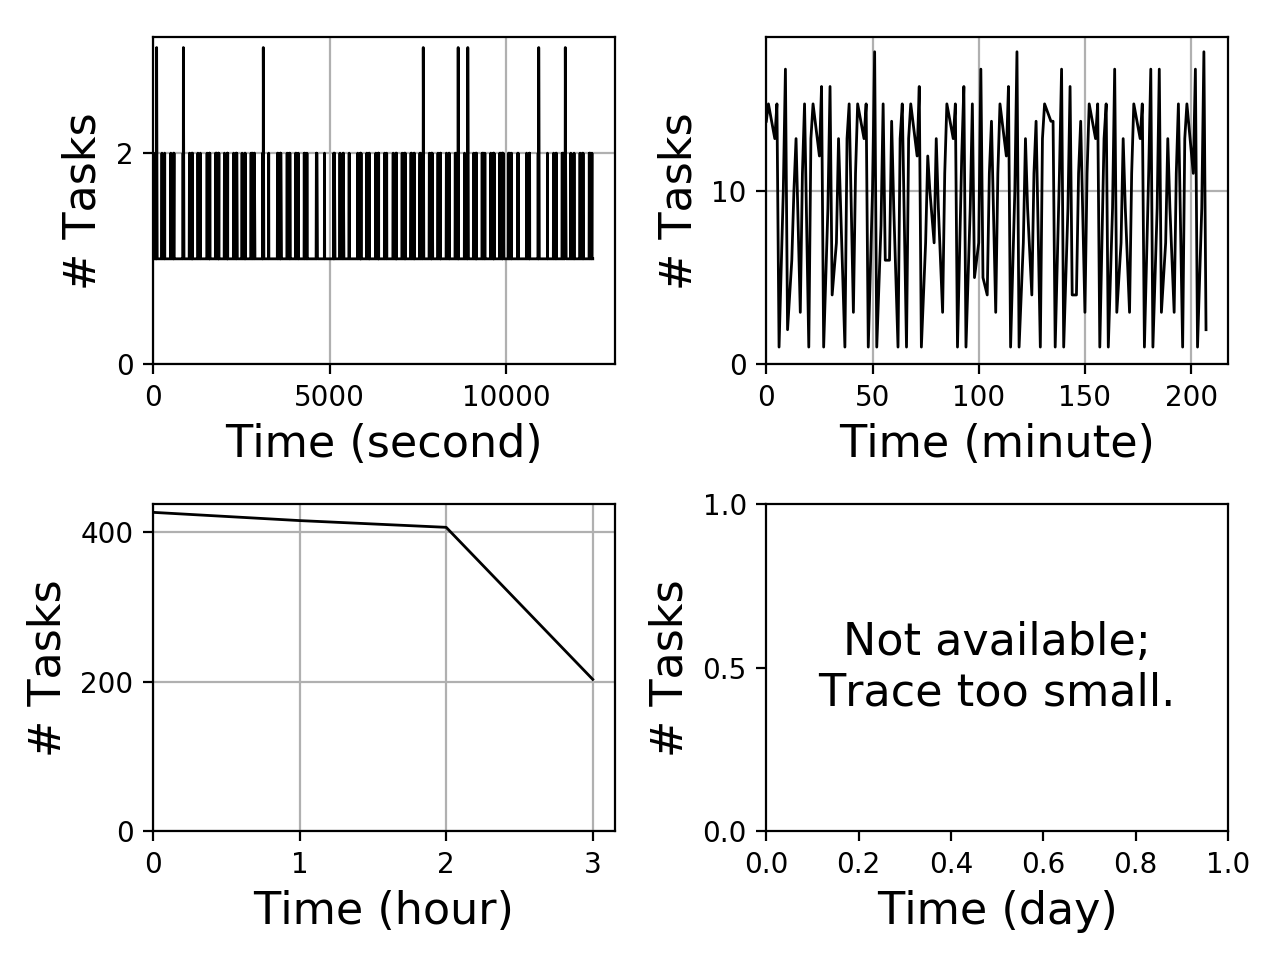
Task arrival graph
The task arrival graph depicts how many tasks arrive over time. The figure below consisting of four sub-plots. The subplots depict four different granularities for the horizontal axis: seconds, minutes, hours, and days. The vertical axis depicts the amount of tasks arriving.
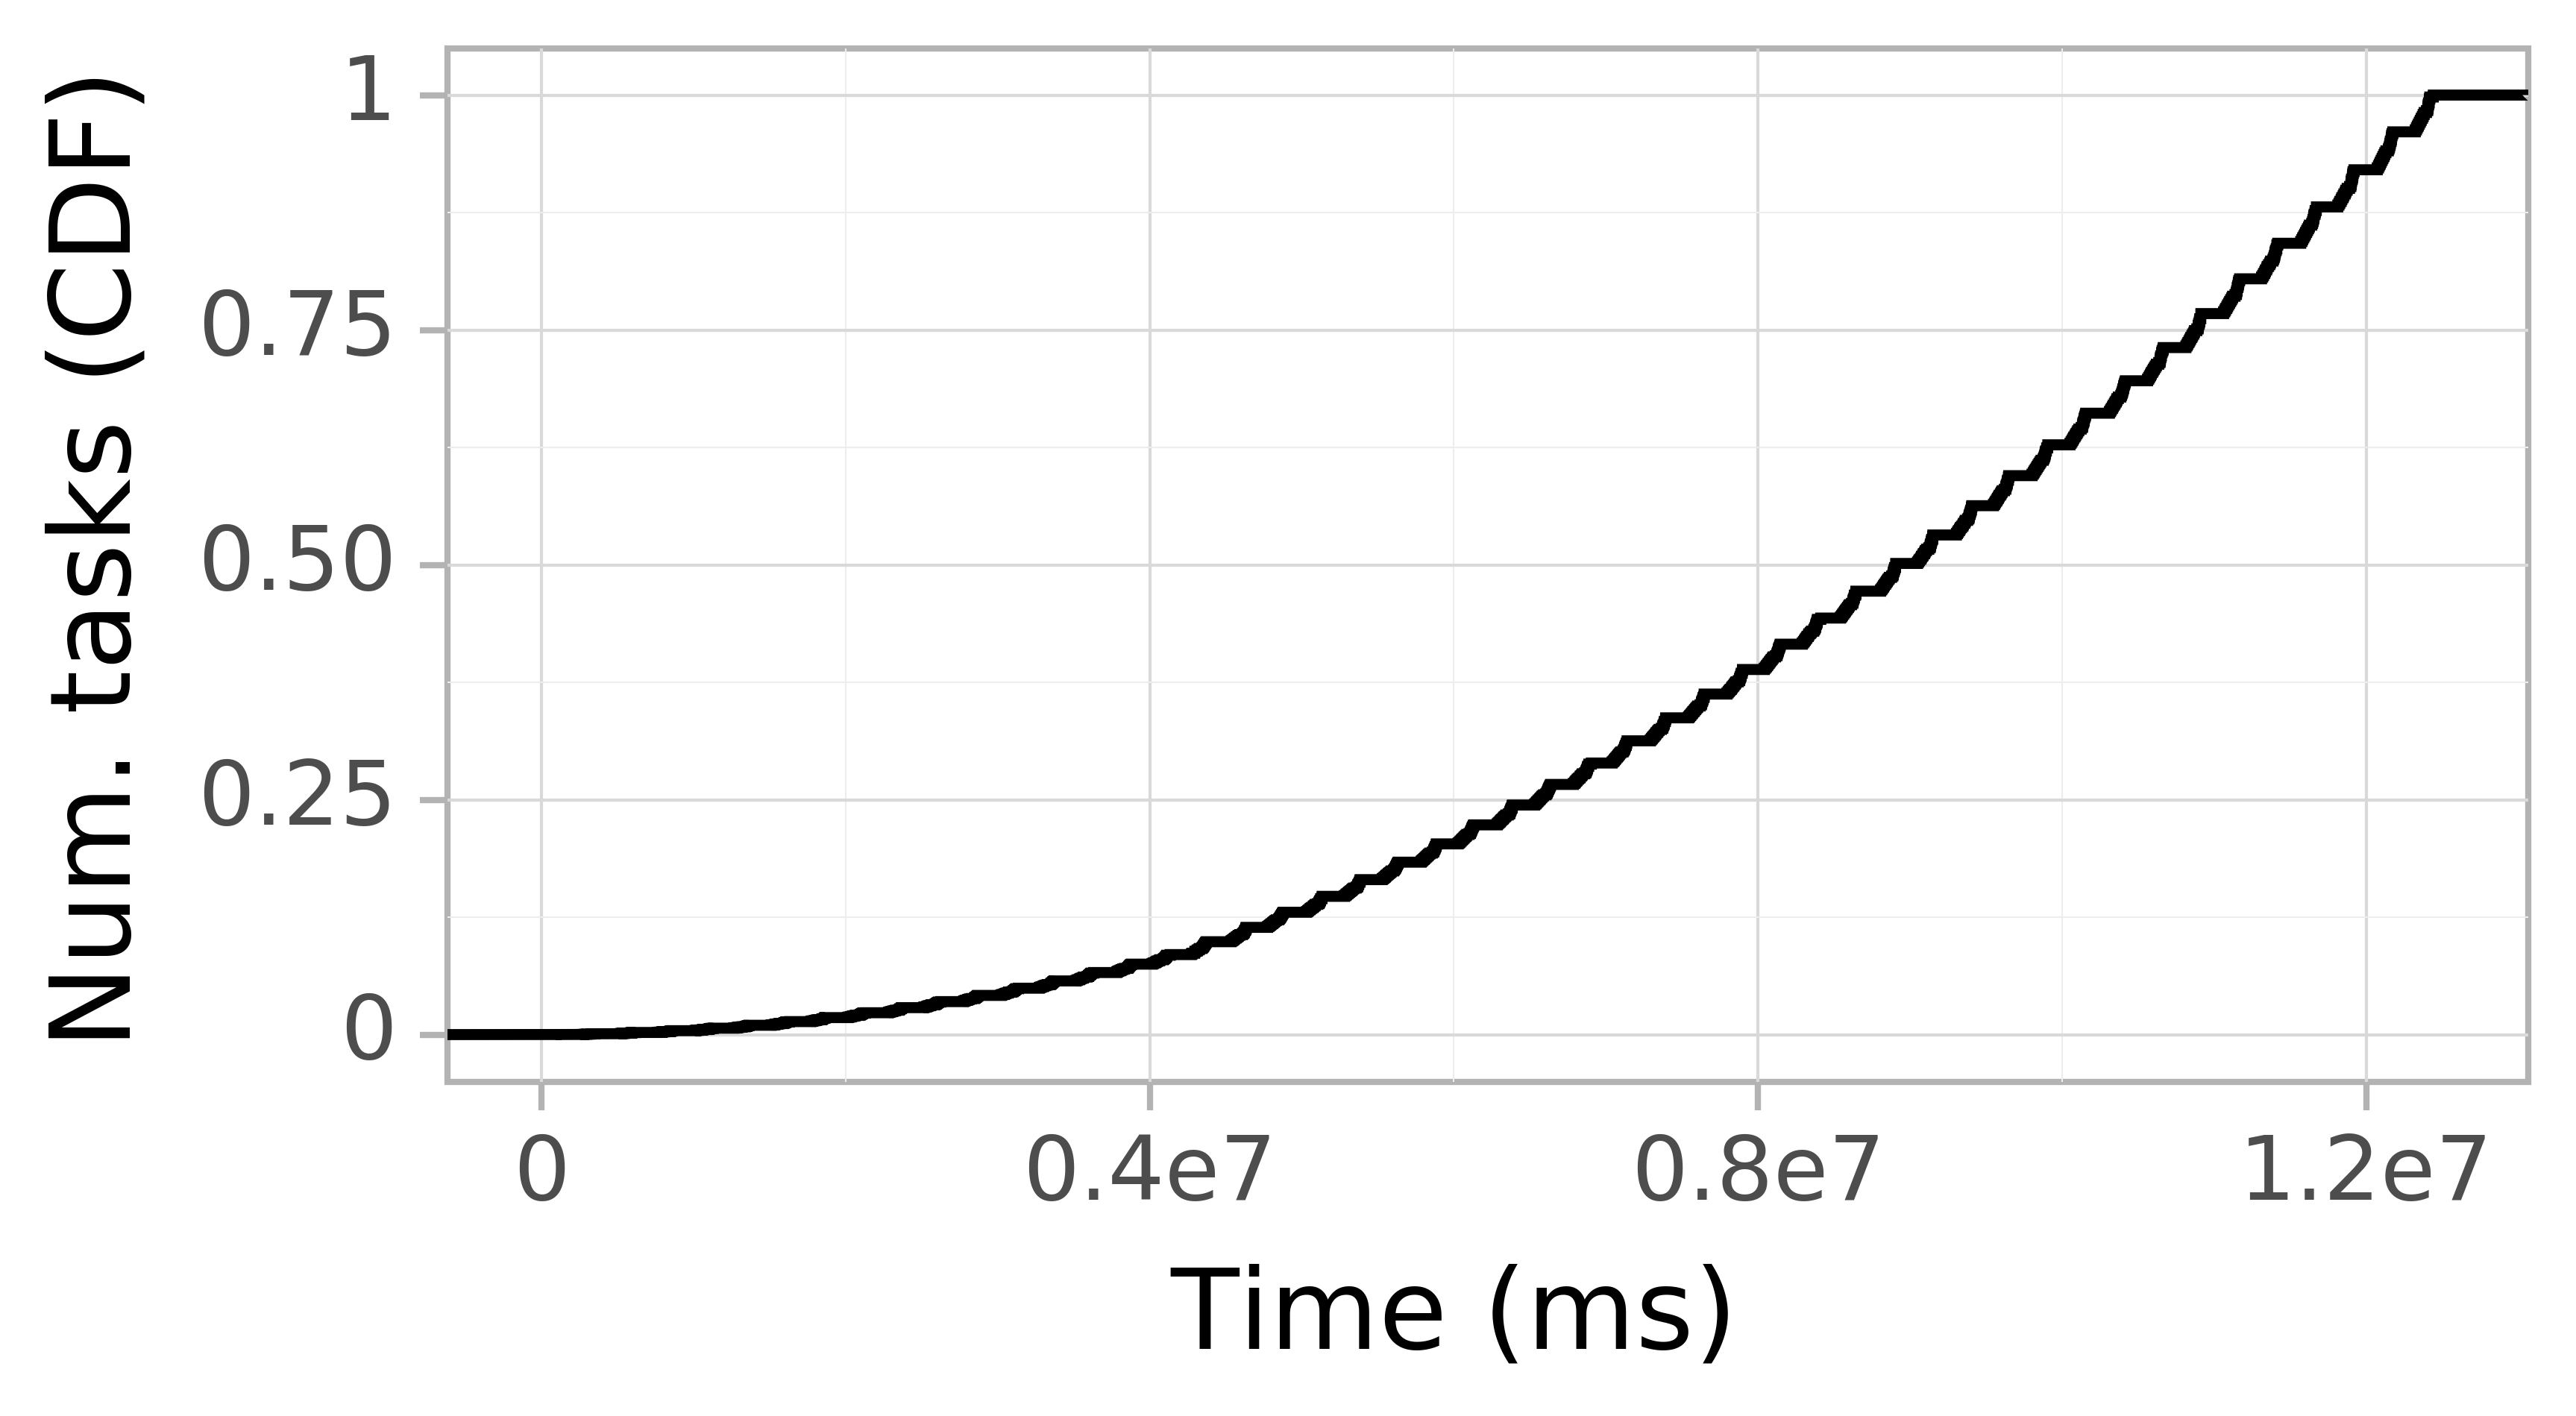
Task Arrival CDF
In a workload of workflows, jobs arrive over time. At the same time, tasks of a job may not arrive at the same time, leading to possible bursty patterns. The figure below depicts on the horizontal axis the task arrival times. The vertical axis depicts the occurrences.
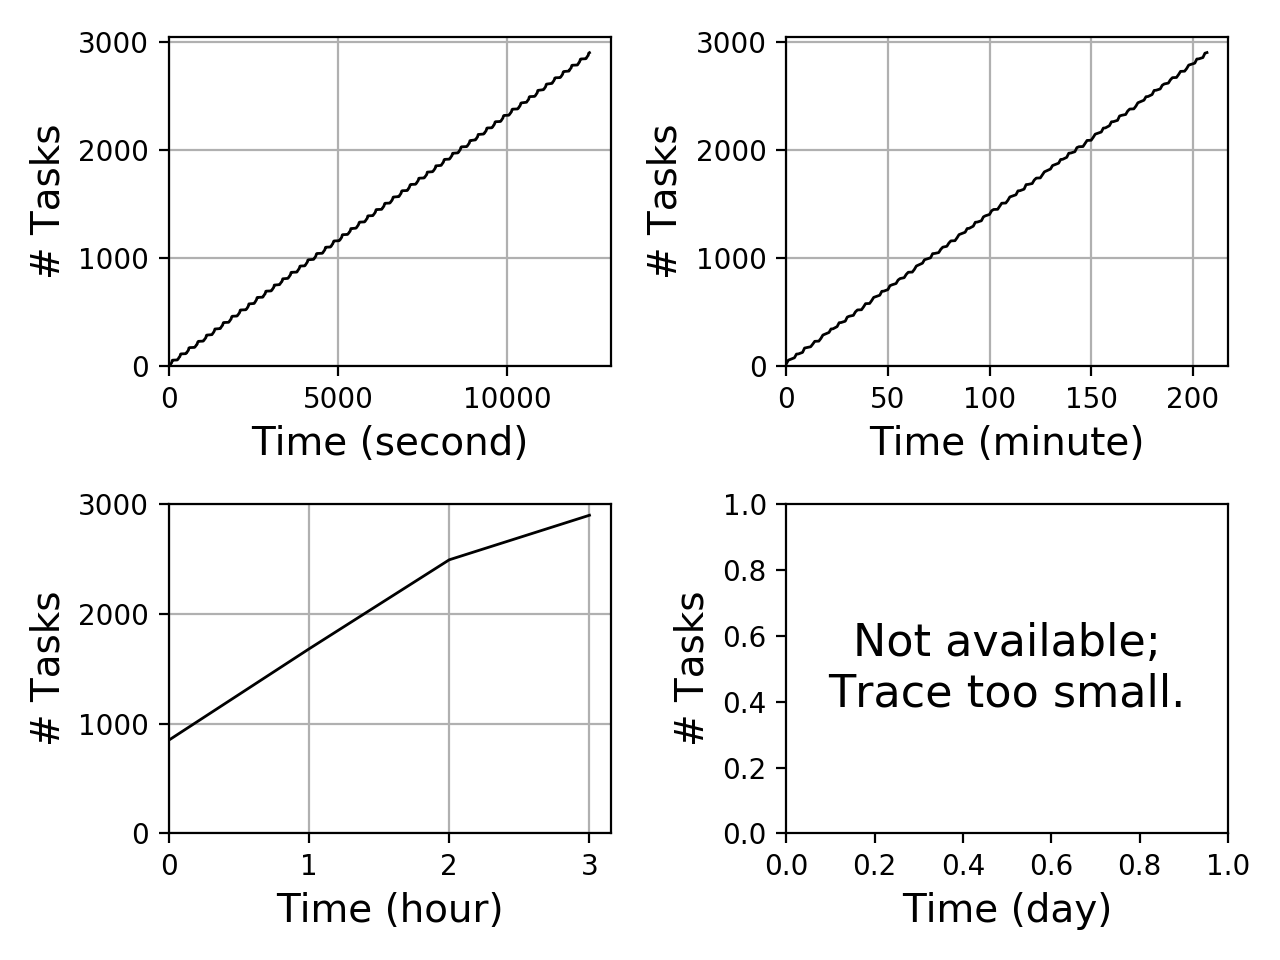
Task Completion Graph
The figure below depicts the amount of completed task over time using four different granularities of time: seconds, minutes, hours, and days. The horizontal axis depicts the time into the experiment. The vertical axis depicts the cumulative amount of completed tasks over time.
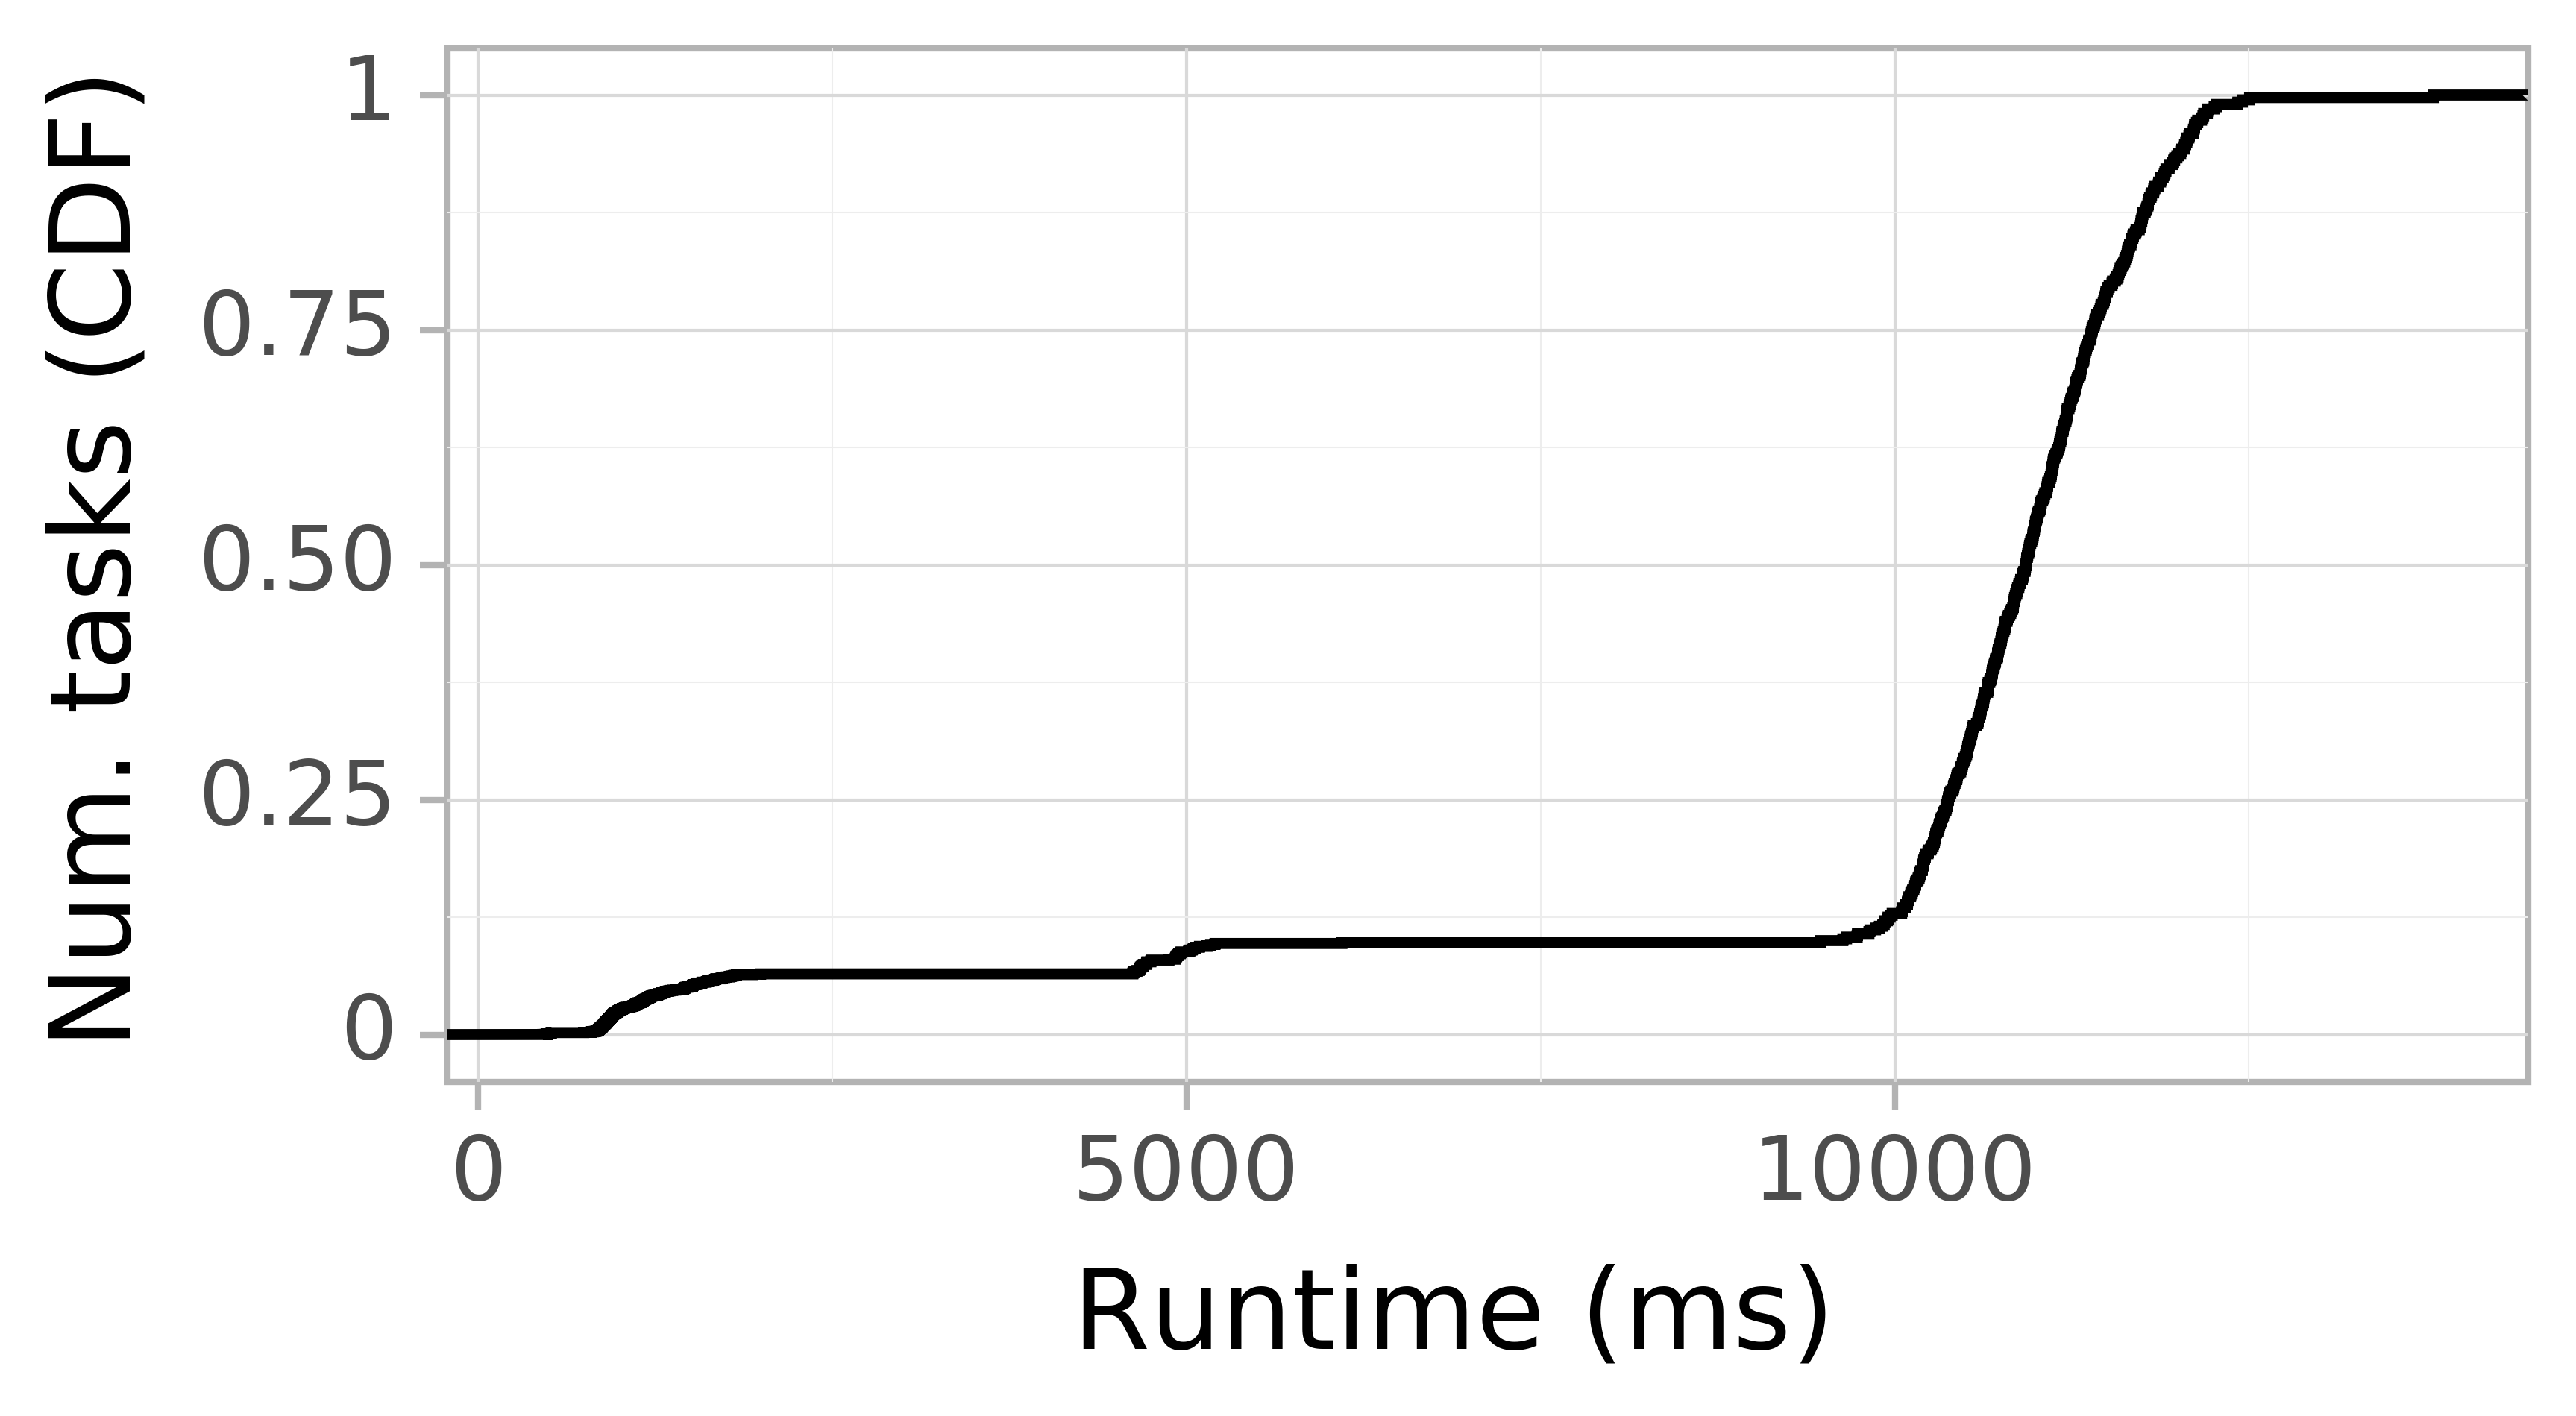
Task runtime CDF
The figure below shows the CDF of task runtimes consumption. The horizontal axis depicts the task runtime in seconds. The vertical axis depicts the occurrences.
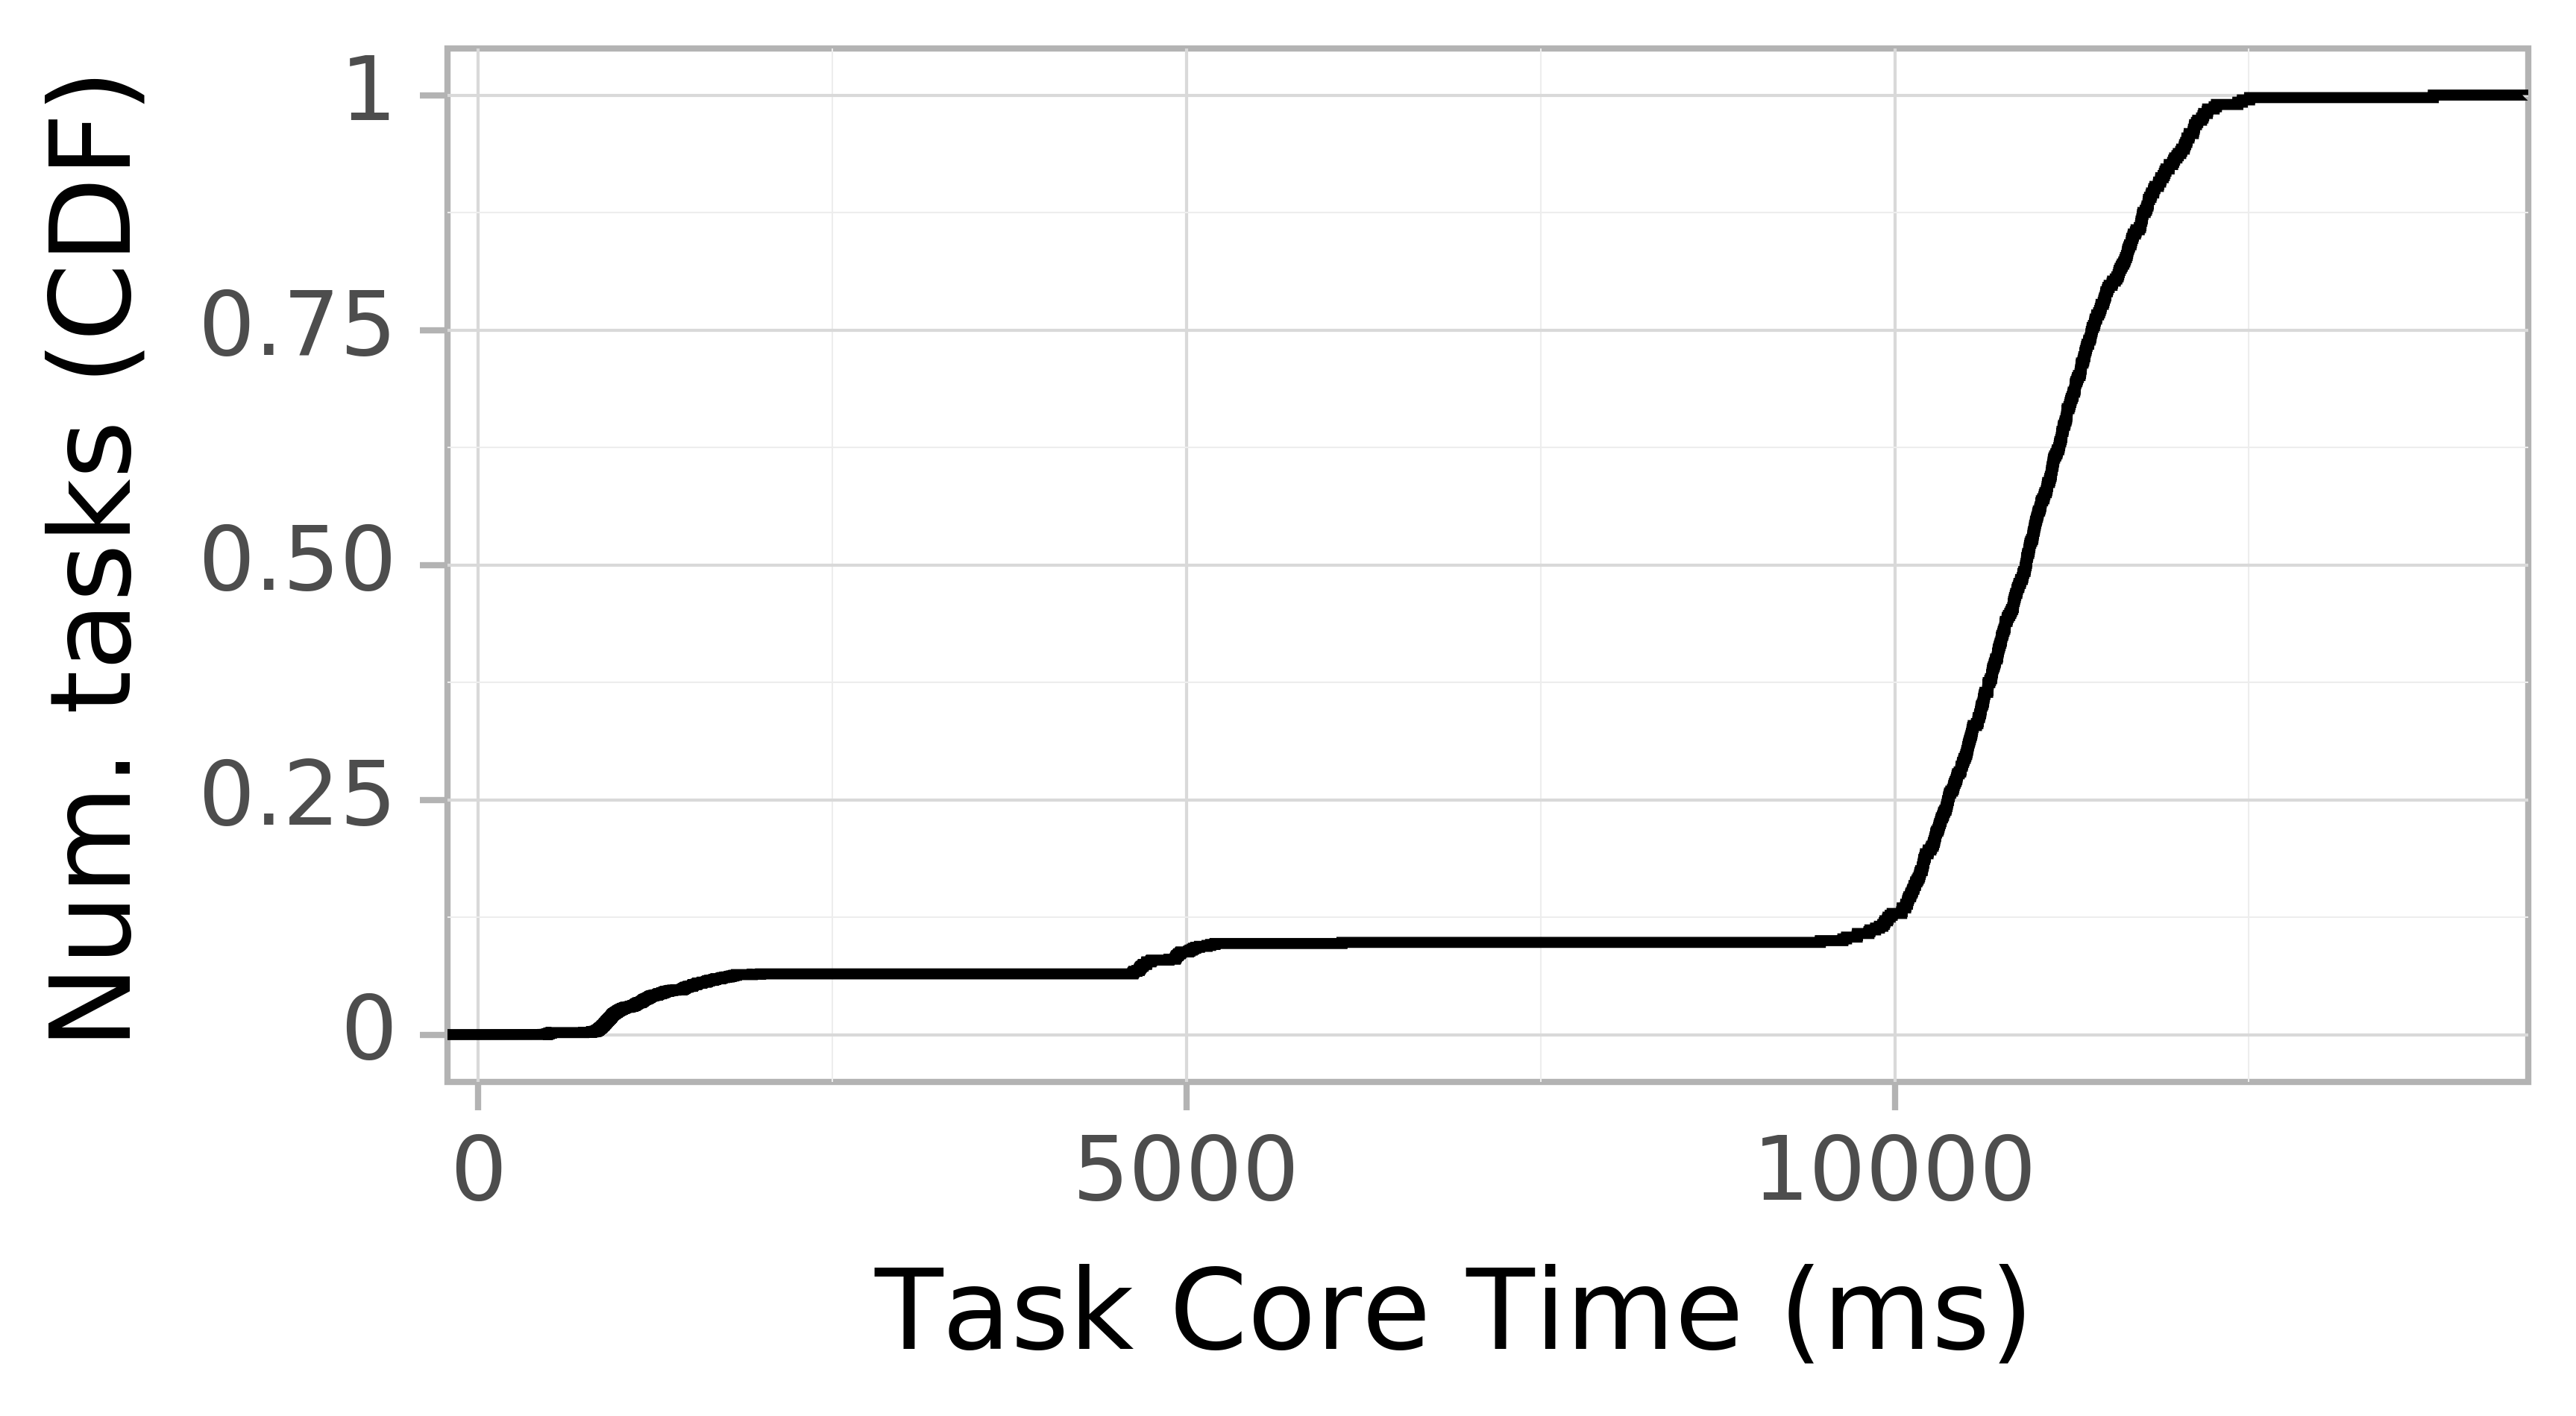
Task Resource Time CDF
We define resource time of a task as the amount of resourcees the task requires multiplied by its runtime. The figure below shows the CDF of task resource time. The horizontal axis depicts the task resource time in seconds. The vertical axis depicts the cumulative amount of completed tasks over time.
Task Wait Time CDF
The figure below shows the CDF of task wait times. The horizontal axis depicts the task runtime in seconds. The vertical axis depicts the occurrences.
Task Memory consumption
The figure below shows the CDF of task memory consumption. The horizontal axis depicts the task CPU time in seconds. The vertical axis depicts the cumulative amount of completed tasks over time.